
← REPORTS · EQUITIES · 03 October 2026
Week ending 2 Oct 2026: S&P 500 -0.2%, a mixed week
The week in one number
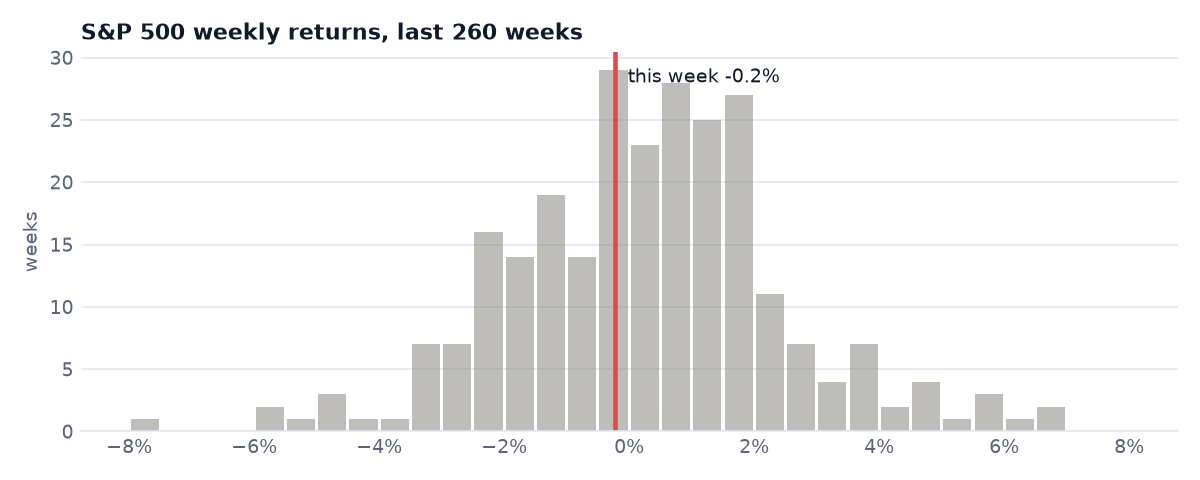
The S&P 500 (SPY) moved -0.2% this week. Measured against its own volatility over the past year that is a 0.1σ week, and over the last 262 weeks a move at least this large, either way, happened most weeks.
Indices and assets
| Week | Year to date | |
|---|---|---|
| S&P 500 (SPY) | -0.2% | +13.7% |
| Nasdaq 100 (QQQ) | +0.7% | +22.4% |
| Russell 2000 small caps (IWM) | -0.2% | +15.1% |
| Dow Jones (DIA) | -1.2% | +7.5% |
| 20+ year Treasuries (TLT) | -1.9% | -8.0% |
| Gold (GLD) | -3.4% | -4.1% |
| VIX (volatility index, level) | 15.3 (+0.4 pts) | — |
Sectors
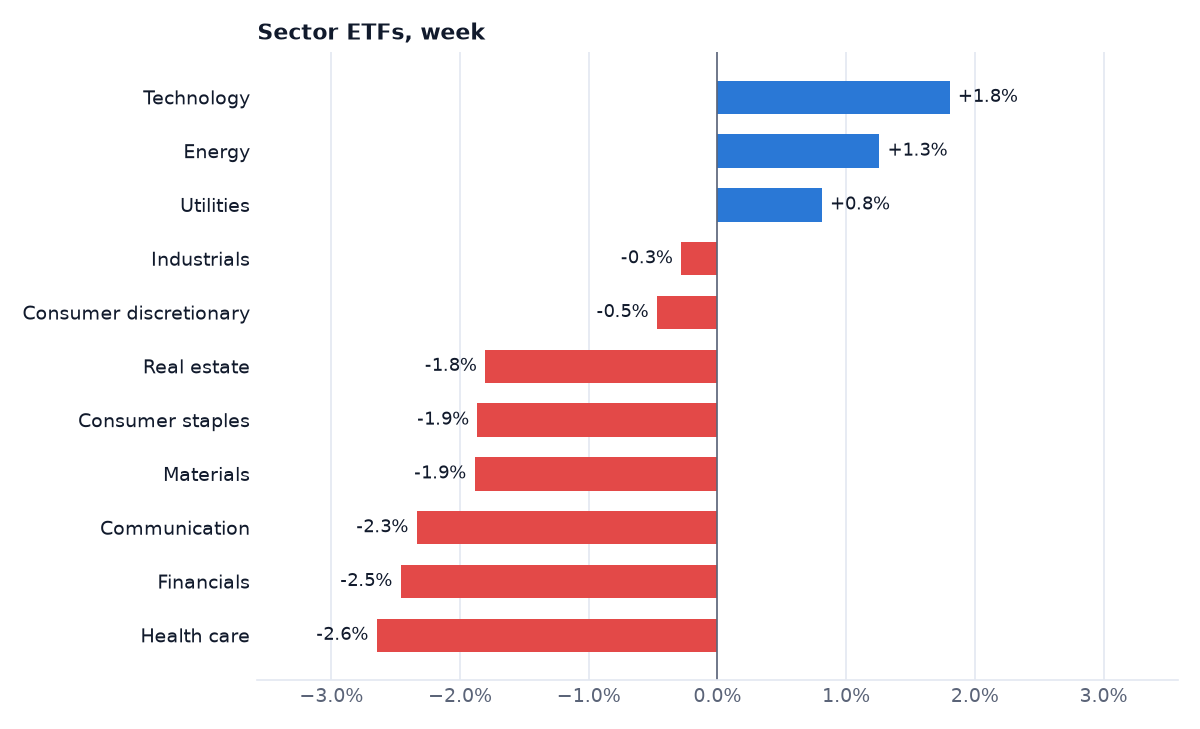
Technology led (+1.8%) and Health care lagged (-2.6%): a spread of 4.5 percentage points between the best and worst sector.
Under the surface
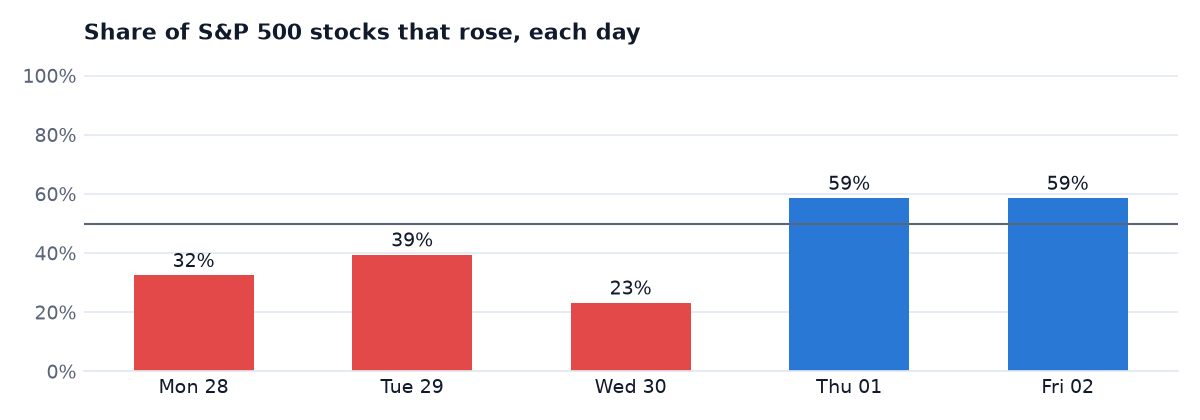
Of the 517 stocks in our S&P 500 universe, 34% rose, and 38% beat the index itself. The typical (median) stock moved -1.1%, the average (equal-weight) stock -0.7%.
The spread between winners and losers (the gap between the stock at the 75th percentile and the one at the 25th) was 4.0%, narrower than 83% of the past year's weeks (typical: 4.7%). 20 stocks closed at a 52-week high during the week and 71 at a 52-week low.
| Sector | Stocks | Median stock | Share that rose |
|---|---|---|---|
| Utilities | 31 | +1.0% | |
| Technology | 67 | +0.9% | |
| Energy | 22 | +0.9% | |
| Industrial | 82 | -0.4% | |
| Communications | 45 | -1.3% | |
| Consumer, Cyclical | 57 | -1.3% | |
| Basic Materials | 17 | -2.1% | |
| Consumer, Non-cyclical | 101 | -2.1% | |
| Financial | 95 | -2.2% |
The luck check
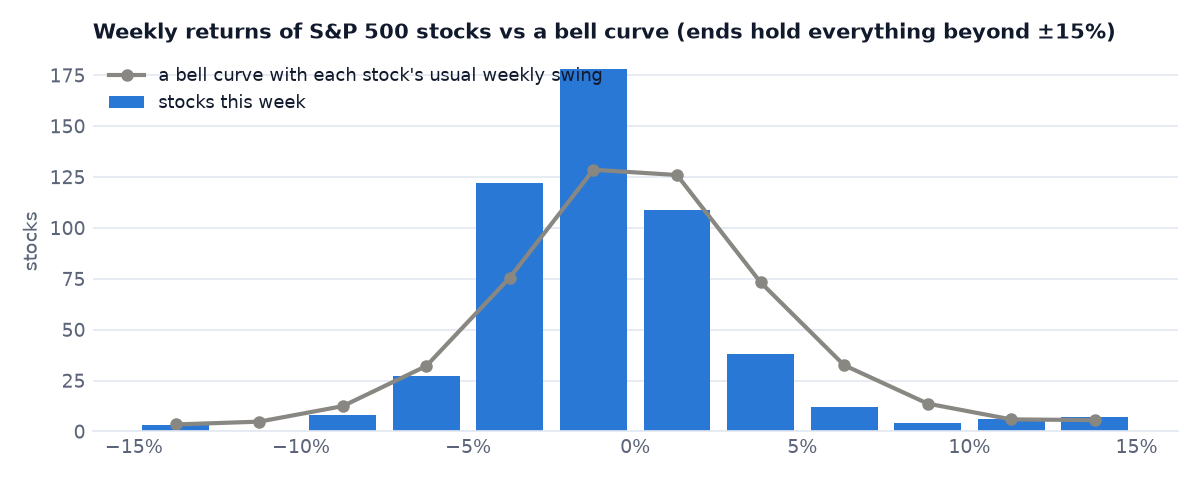
16 stocks moved more than 10% this week (13 up, 3 down). If each stock's weekly return were an independent draw from a bell curve with its usual weekly swing, we would expect about 19.8. That is close to this simple model's expectation (it puts 90% of weeks between 13 and 27), so the count alone gives little evidence that the week was unusual. It cannot show the opposite either: the model treats stocks as independent, and they are not.
Biggest movers
| Gainers | Sector | Week |
|---|---|---|
| CCL | Consumer, Cyclical | +15.8% |
| LITE | Technology | +15.3% |
| SNPS | Technology | +15.1% |
| RCL | Consumer, Cyclical | +14.4% |
| COHR | Industrial | +13.9% |
| Losers | Sector | Week |
|---|---|---|
| FICO | Technology | -23.4% |
| ALNY | Consumer, Non-cyclical | -14.2% |
| APP | Communications | -13.7% |
| GPN | Consumer, Non-cyclical | -9.4% |
| WDC | Technology | -9.1% |
What this week does not tell us
- Small overall market move: The S&P 500 fell by just 0.22%, a move smaller than 92% of past weeks, so this week does not provide strong evidence of a new trend or regime change in the market.
- Sector performance differences: Technology and Energy sectors rose modestly while Financials and Health Care declined, but these mixed results over one week cannot reliably indicate a durable sector rotation or leadership shift.
- Low market breadth: Only about 34% of stocks rose and the median stock declined by 1.1%, yet the S&P 500 was almost flat; this divergence could reflect a few large stocks offsetting broad weakness, but one week is too short to conclude anything about market health.
- Number of big movers within normal range: Sixteen stocks moved more than 10%, close to the 13–27 range expected from the model, so the amount of extreme individual stock moves this week does not signal unusual market stress or exuberance.
Data: index, sector, VIX and named-stock prices from Yahoo Finance (adjusted closes); breadth, dispersion, highs and lows and the luck check computed from unadjusted daily closes of the 517 stocks in our S&P 500 universe (the US stocks our trading database tracks, with each share class counted (FOX/FOXA, NWS/NWSA); this list is not reconciled with the index's official constituents for the week, and at 517 it is larger than the index's ~503 lines, so it includes some stocks that are not current members), published as aggregates only; left out of every figure above, because a weekly price change beyond ±50% reflects a corporate action or a bad print rather than what shareholders gained or lost: CTVA (spun off Vylor, one VYLR share per CTVA share, 1 Oct 2026). Weeks run Friday close to Friday close. Not investment advice.
WAS THIS USEFUL?
Thanks. Add a line if you like.Thanks. Every note is read.
Anonymous: saved without any link to you (no account, cookie or IP address), kept for up to 12 months, and read only by the person who builds these games. Please leave out names, email addresses and other personal details.