
← REPORTS · EQUITIES · 17 October 2026
Week ending 16 Oct 2026: S&P 500 -2.0%, down, but most stocks held up
The week in one number
The S&P 500 (SPY) moved -2.0% this week. Measured against its own volatility over the past year that is a 1.2σ week, and over the last 262 weeks a move at least this large, either way, happened about 1 week in 3.
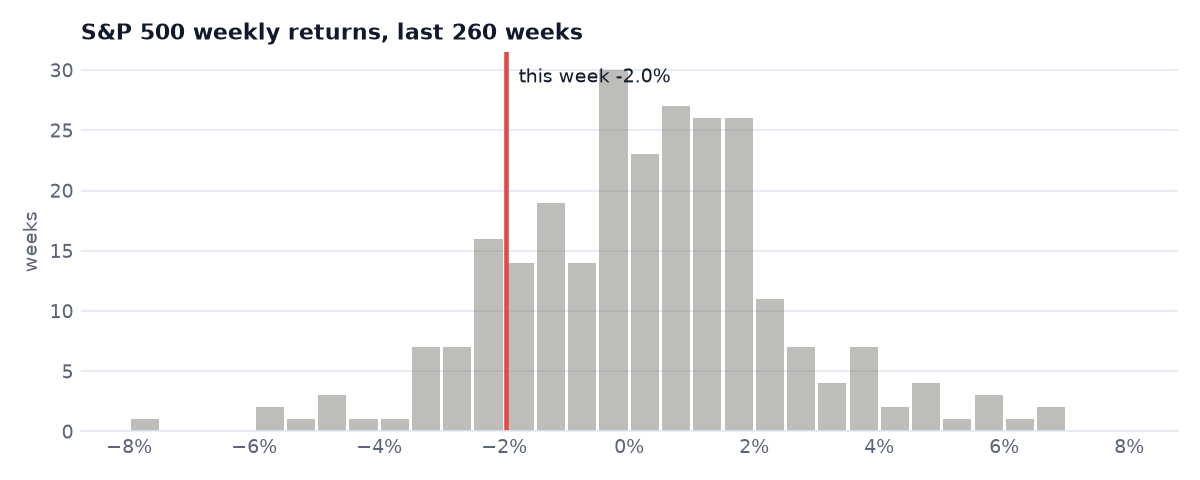
A sharp fall in technology shares, led by optical-networking and AI-infrastructure names (pressured by hyperscaler capex bottleneck concerns and a sharp widening in AI debt credit spreads), pulled the cap-weighted index down 2.0% while most stocks rose: staples, energy and health care gained 3.5–5%, and 68% of the 518 stocks in our S&P 500 universe ended the week higher.
Indices and assets
| Week | Year to date | |
|---|---|---|
| S&P 500 (SPY) | -2.0% | +12.8% |
| S&P 500 equal weight (RSP) | +0.5% | +13.1% |
| Nasdaq 100 (QQQ) | -5.5% | +15.9% |
| Russell 2000 small caps (IWM) | -3.0% | +10.6% |
| Dow Jones (DIA) | +0.6% | +9.2% |
| 20+ year Treasuries (TLT) | +2.7% | -5.0% |
| Gold (GLD) | -0.7% | -3.6% |
| VIX (volatility index, level) | 20.0 (+5.1 pts) | — |
Sectors
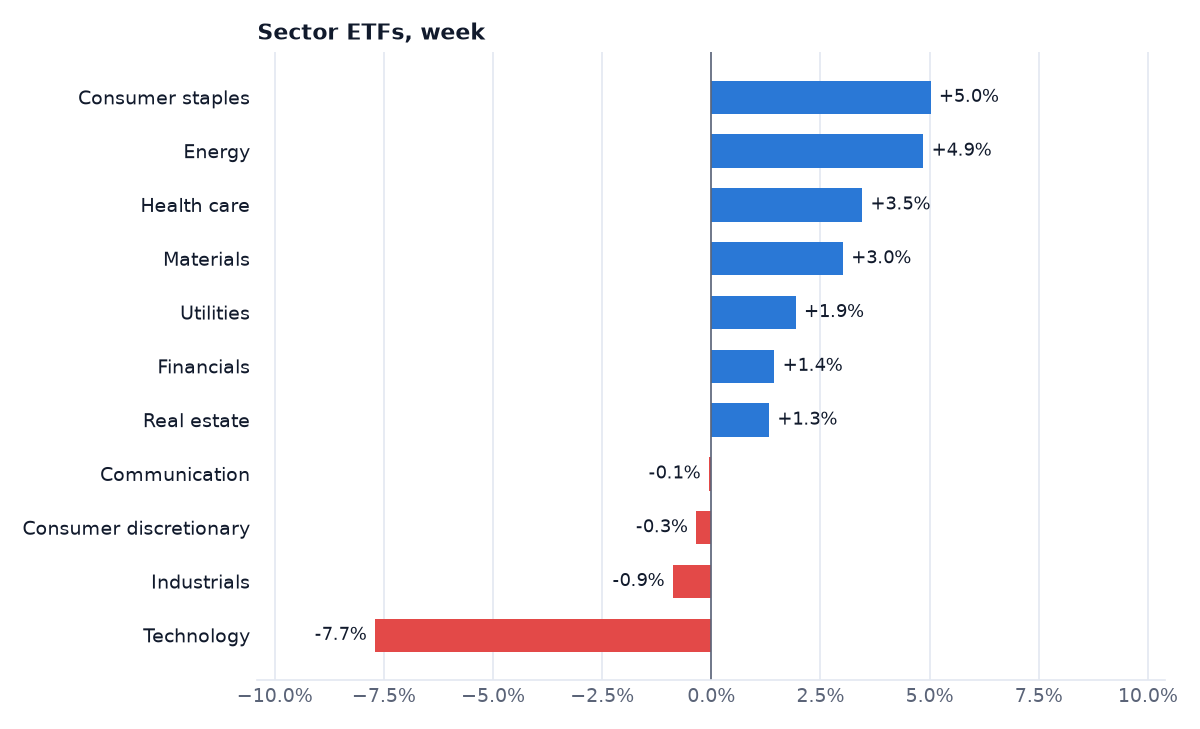
Consumer staples led (+5.0%) and Technology lagged (-7.7%): a spread of 12.7 percentage points between the best and worst sector.
| Sector ETF | Week | 4 weeks | 13 weeks | Rank over the 13 weeks before |
|---|---|---|---|---|
| Consumer staples (XLP) | +5.0% | +6.5% | +3.5% | 4 of 11 |
| Energy (XLE) | +4.9% | +6.7% | +19.0% | 1 of 11 |
| Health care (XLV) | +3.5% | +5.3% | +10.1% | 3 of 11 |
| Materials (XLB) | +3.0% | +2.3% | +1.2% | 7 of 11 |
| Utilities (XLU) | +1.9% | +3.5% | -5.9% | 11 of 11 |
| Financials (XLF) | +1.4% | -0.3% | -1.0% | 6 of 11 |
| Real estate (XLRE) | +1.3% | +0.0% | -6.4% | 9 of 11 |
| Communication (XLC) | -0.1% | -0.1% | +0.0% | 5 of 11 |
| Consumer discretionary (XLY) | -0.3% | +1.5% | -2.4% | 8 of 11 |
| Industrials (XLI) | -0.9% | -0.9% | -6.2% | 10 of 11 |
| Technology (XLK) | -7.7% | -3.1% | +4.6% | 2 of 11 |
Consumer staples, this week's best sector, was 4th of 11 over the 13 weeks before; Technology, the worst, was 2nd. One week's order says little on its own: the longer columns show which moves are new and which continue.
Styles and factors
| Style ETF | Week | Against the S&P 500 | Its typical weekly gap | 4 weeks | 13 weeks |
|---|---|---|---|---|---|
| Momentum (MTUM) | -8.4% | -6.4% | ±1.1 pts | -5.3% | -2.8% |
| Value (VLUE) | -3.6% | -1.7% | ±1.1 pts | -3.8% | +2.0% |
| Quality (QUAL) | -1.0% | +1.0% | ±0.5 pts | +2.6% | +3.5% |
| Low volatility (USMV) | +0.7% | +2.7% | ±1.0 pts | +2.9% | +5.2% |
| Small caps (IWM) | -3.0% | -1.1% | ±0.9 pts | -4.8% | -7.8% |
The largest gap, set against each fund's own usual gap, was Momentum (MTUM): 6.4 percentage points behind the S&P 500, wider than in any of the past 52 weeks. Each fund holds the stocks a published rule picks for one trait; a week or two of one trait doing better says little about the next.
Try it yourself: a fund beat the market. Take it apart into market, size, value and momentum, then decide: was any of it skill? Play Name the Factor →
Under the surface
Of the 518 stocks in our S&P 500 universe, 68% rose, and 77% beat the index itself. The typical (median) stock moved +2.5%, the average (equal-weight) stock +0.4%.
The S&P 500 (-2.0%) trailed its equal-weight version (RSP, +0.5%), which gives every member the same weight, by 2.5 percentage points: the largest companies did worse than the typical member. A gap at least this wide, either way, came in 2% of the past 52 weeks (typical: 1.0 percentage point).
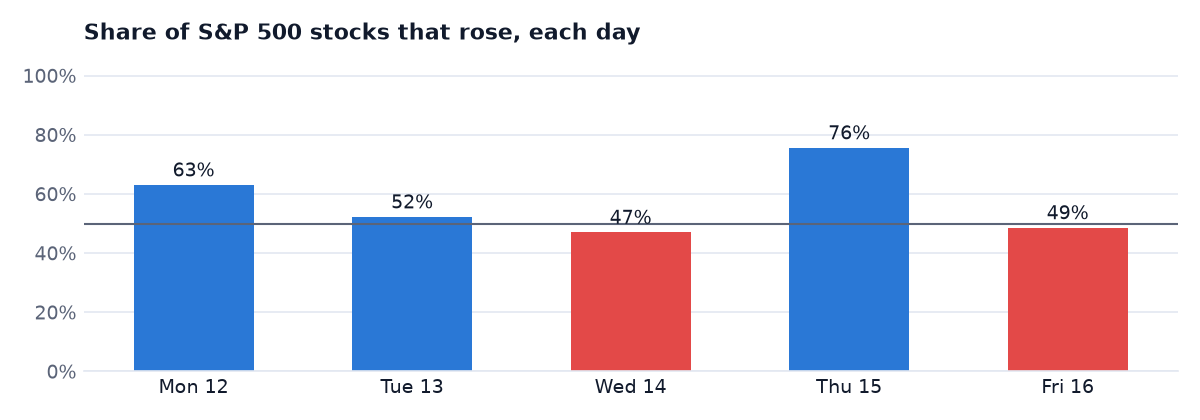
The spread between winners and losers (the gap between the stock at the 75th percentile and the one at the 25th) was 6.5%, wider than 90% of the past year's weeks (typical: 4.7%). 47 stocks closed at a 52-week high during the week and 17 at a 52-week low.
Stocks moved together more closely than in 77% of the past 52 weeks: the average correlation between pairs of stocks' daily returns was 0.21 (typical: 0.12; 0 would mean no linear relationship, 1 that they moved in lockstep). When stocks move together, holding more of them spreads risk less. Five days is a short window for any one pair, but the same measure is taken every week over 518 stocks, so the weeks can be compared.
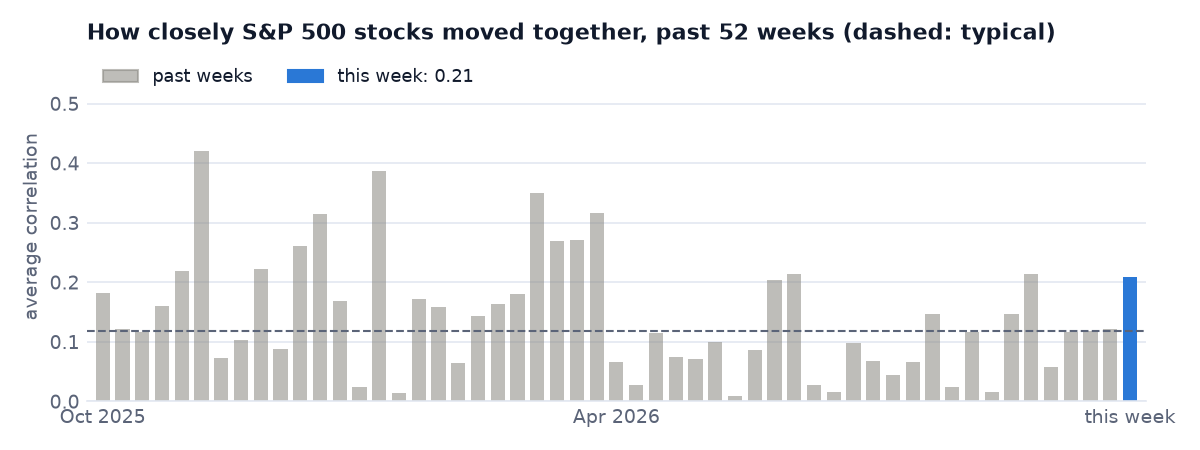
Try it yourself: pick three to ten real stocks and replay a year of their history. How much does mixing them really calm the swings? Play Portfolio Challenge →
| Sector | Stocks | Median stock | Share that rose |
|---|---|---|---|
| Energy | 22 | +4.5% | |
| Consumer, Non-cyclical | 102 | +4.4% | |
| Consumer, Cyclical | 57 | +3.3% | |
| Utilities | 31 | +3.1% | |
| Basic Materials | 17 | +3.0% | |
| Financial | 95 | +1.7% | |
| Industrial | 82 | +1.1% | |
| Communications | 44 | -0.1% | |
| Technology | 68 | -7.5% |
The luck check
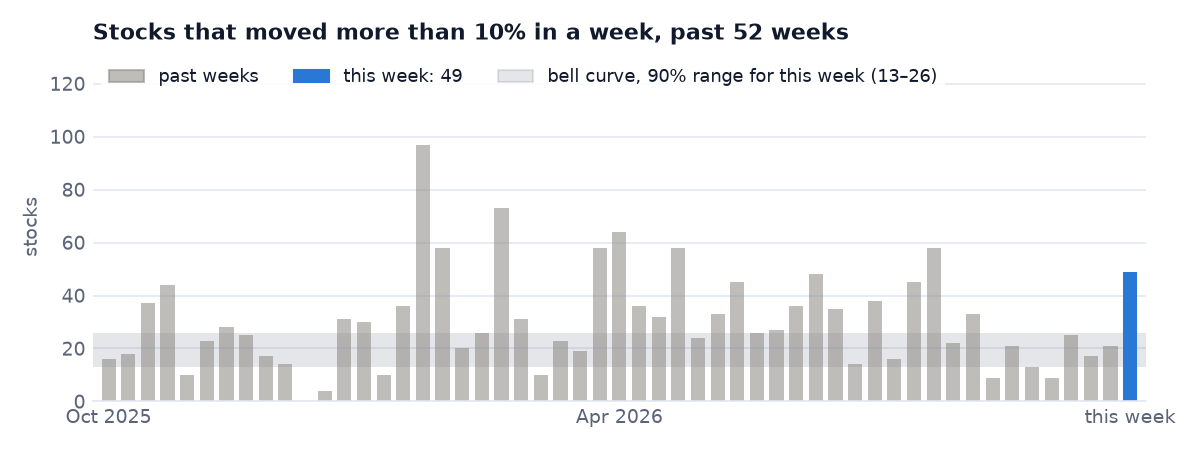
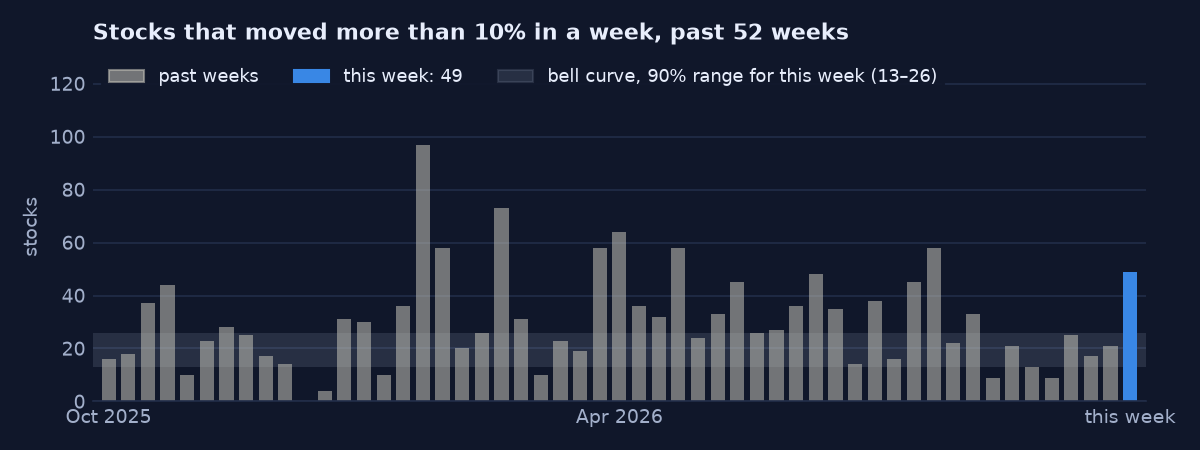
49 stocks moved more than 10% this week (4 up, 45 down), counted on our database's closes. If each stock's weekly return were an independent draw from a bell curve with its usual weekly swing, we would expect about 19.6. That is above the range this simple model gives for 90% of weeks (13 to 26), so a count this high would be unusual if the model were right. Three things can each produce it: an eventful week for single stocks; returns with fatter tails than a bell curve, which they are known to have; and stocks moving together (this week's average correlation was 0.21), which the model ignores by treating them as independent. The count alone cannot say which.
The biggest-movers tables below use Yahoo's closes, which are adjusted for dividends, and the luck check uses our database's unadjusted closes, so a stock close to ±10% can count in one and not the other: here the gainers table lists 5 above +10% against 4 in the count.
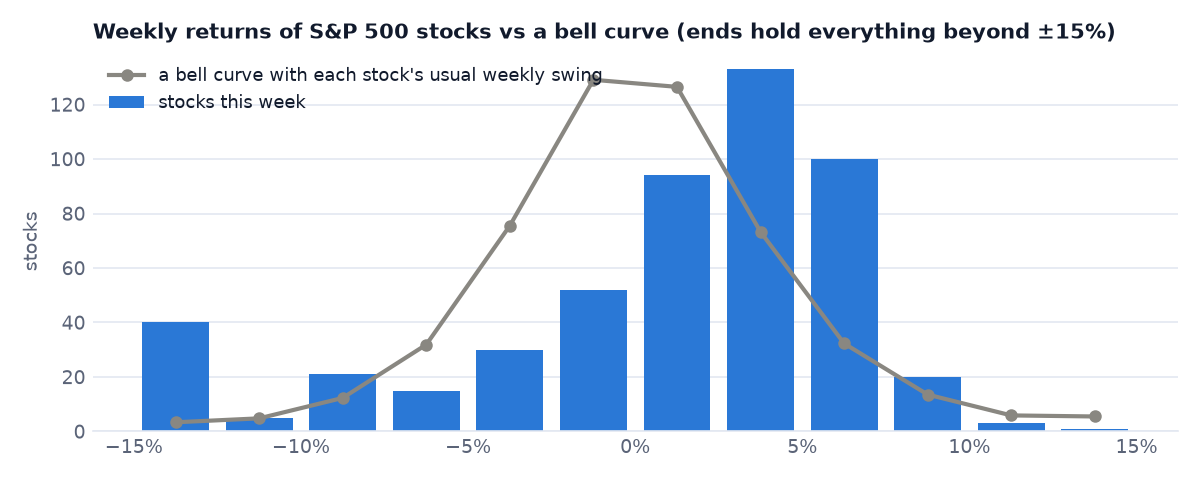
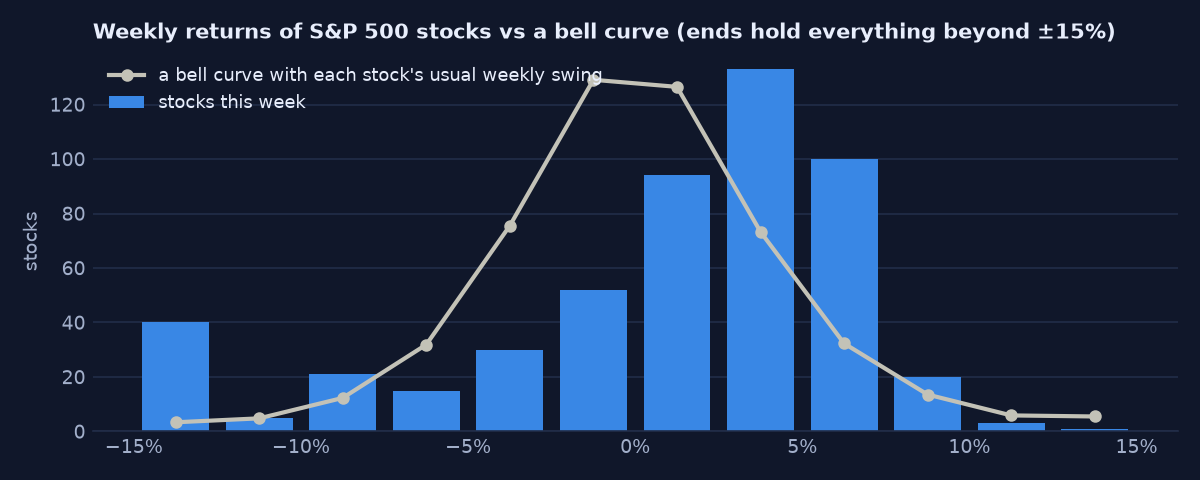
Measured against the past instead of a model: over the last 52 weeks the count was typically 26, and this week's 49 was higher than in 87% of them and lower than in 13%.
Try it yourself: ten pairs of charts, one real stock and one random walk in each. Can you beat a coin flip? Play Real or Random? →
Biggest movers
| Gainers | Sector | Week |
|---|---|---|
| FICO | Technology | +15.5% |
| CTSH | Technology | +11.5% |
| ACN | Technology | +10.7% |
| EFX | Consumer, Non-cyclical | +10.6% |
| BRO | Financial | +10.4% |
| Losers | Sector | Week |
|---|---|---|
| CIEN | Communications | -26.0% |
| COHR | Industrial | -25.5% |
| RKLB | Industrial | -25.5% |
| LITE | Technology | -25.3% |
| CRWV | Technology | -25.2% |
Earnings this week, after the fact
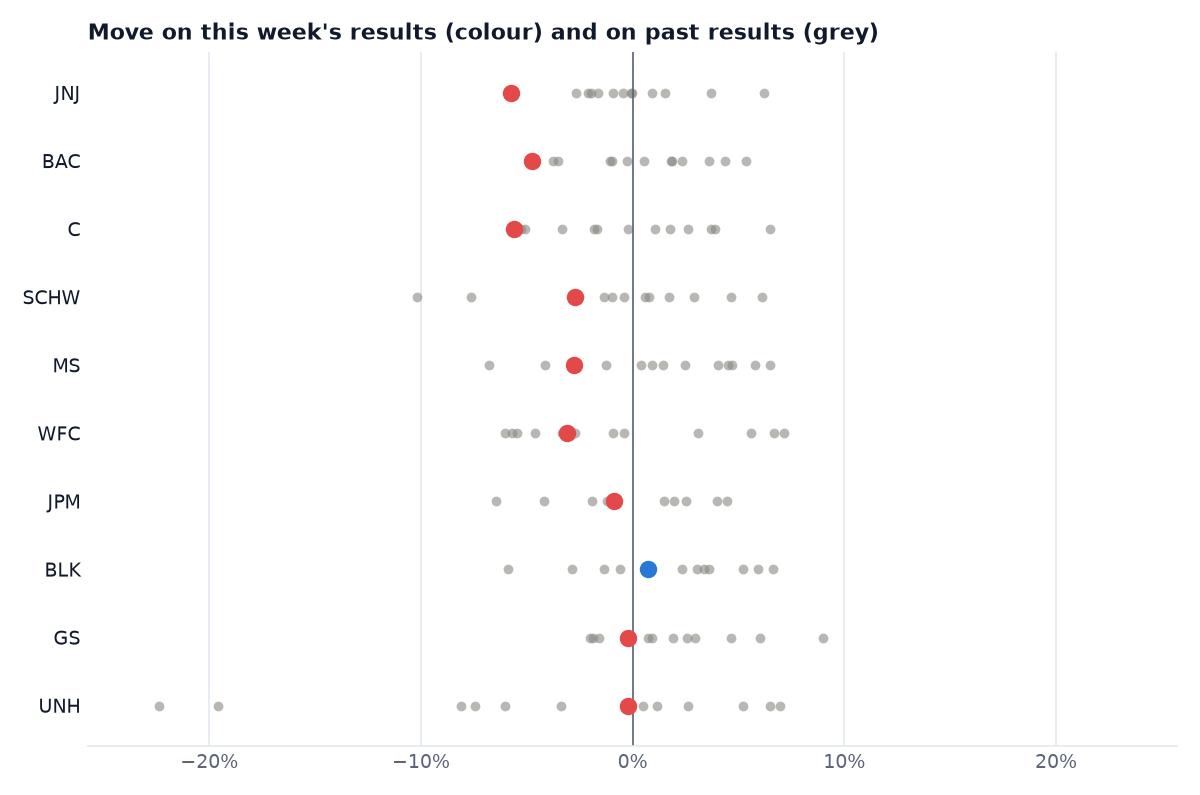
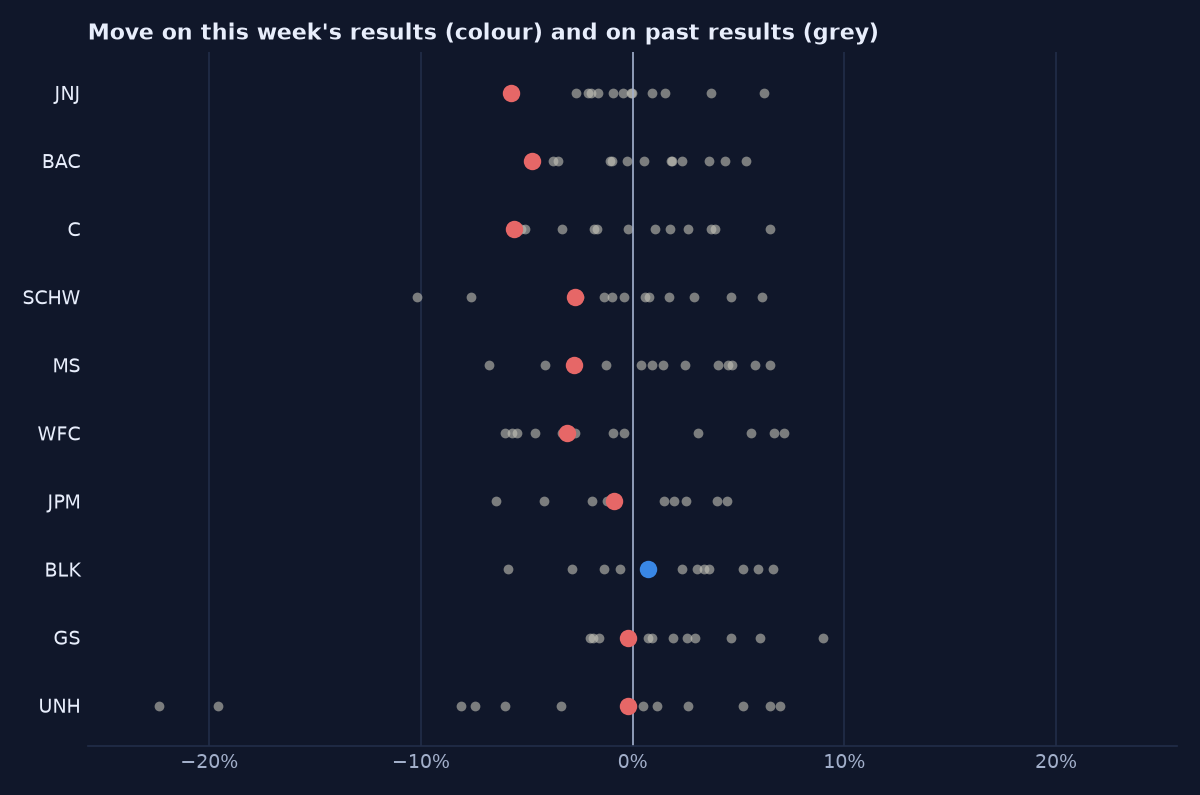
| Company | Reported | Move | S&P 500 | Its usual move | Bigger than |
|---|---|---|---|---|---|
| JNJ | Tue 13 Oct, before the open | -5.7% | +0.0% | ±1.6% | 11 of 12 past |
| BAC | Wed 14 Oct, before the open | -4.8% | -1.1% | ±2.1% | 11 of 12 past |
| C | Tue 13 Oct, before the open | -5.6% | +0.0% | ±3.0% | 11 of 12 past |
| SCHW | Thu 15 Oct, before the open | -2.7% | +0.3% | ±2.1% | 7 of 12 past |
| MS | Wed 14 Oct, before the open | -2.7% | -1.1% | ±4.1% | 5 of 12 past |
| WFC | Tue 13 Oct, before the open | -3.1% | +0.0% | ±5.0% | 4 of 12 past |
| JPM | Tue 13 Oct, before the open | -0.9% | +0.0% | ±1.9% | 3 of 12 past |
| BLK | Wed 14 Oct, before the open | +0.7% | -1.1% | ±3.2% | 1 of 12 past |
| GS | Tue 13 Oct, before the open | -0.2% | +0.0% | ±2.0% | 1 of 12 past |
| UNH | Tue 13 Oct, before the open | -0.2% | +0.0% | ±6.3% | 0 of 12 past |
4 of 10 moved more than their own typical earnings-day move. A 5% move on results is ordinary for some companies and rare for others, so each move is set against the same company's past reports rather than against the market. The move includes everything else that happened on those days; the S&P 500 column is the whole market over the same days. "Its usual move" is the median size of the company's moves, up or down, on up to 12 earlier reports.
Last week's movers, one week on
| Last week's mover | Was a | Last week | This week |
|---|---|---|---|
| PTC | gainer | +35.0% | -0.8% |
| CCI | gainer | +19.9% | +3.3% |
| MRNA | gainer | +18.4% | -3.1% |
| CEG | gainer | +15.8% | -9.0% |
| VST | gainer | +15.3% | -5.9% |
| ARM | loser | -13.4% | -14.5% |
| INTC | loser | -12.3% | -14.2% |
| MOS | loser | -11.1% | +0.4% |
| TER | loser | -10.3% | -19.3% |
| SWKS | loser | -10.2% | +4.4% |
1 of last week's 5 biggest gainers rose again this week (average -3.1%); 3 of last week's 5 biggest losers fell again this week (average -8.6%). Five names a side is far too few to say whether big weekly moves tend to continue or reverse: the record builds up week by week.
Try it yourself: two hundred fund managers, three years of track record. Hire the best, then see whether the record lasts. Play The Star Manager →
What this week does not tell us
- The largest companies are done leading. The equal-weight index beat the S&P 500 by 2.5 points, a gap seen in only 2% of past weeks. It came in the same week Technology, where the largest companies sit, fell 7.7% while the median stock rose 2.5%; these figures do not say how much of the gap that one sector explains, and one week cannot show whether it lasts.
- Momentum investing has stopped working. MTUM trailed the S&P 500 by 6.4 points, wider than any week in the past year. A fund that holds recent winners will hold whatever just fell hardest when they reverse; one week cannot show whether that lasts.
- Treasuries rising means investors fled to safety. Long-dated Treasuries gained 2.7%, but the same week saw 68% of stocks rise. A broad flight from risk would look different.
- 49 stocks moving over 10% means single stocks were unusually volatile everywhere. 45 of the 49 were falls, and the sector table shows the weakness concentrated in technology (median stock −7.5%, 34% rose), yet the VIX also rose 5.1 points to 20. The count mixes a rise in market-wide volatility with one group's sell-off, and cannot separate the two.
Scheduled next week
- EFX reports earnings on Tue 20 Oct
- GE reports earnings on Tue 20 Oct
- RTX reports earnings on Tue 20 Oct
- ABT reports earnings on Wed 21 Oct
- ISRG reports earnings on Wed 21 Oct
- NFLX reports earnings on Wed 21 Oct
- T reports earnings on Wed 21 Oct
- TMO reports earnings on Wed 21 Oct
- CMCSA reports earnings on Thu 22 Oct
- HON reports earnings on Thu 22 Oct
- IBM reports earnings on Thu 22 Oct
- LMT reports earnings on Thu 22 Oct
- META reports earnings on Thu 22 Oct
- PG reports earnings on Thu 22 Oct
- TSLA reports earnings on Thu 22 Oct
- TXN reports earnings on Thu 22 Oct
- UNP reports earnings on Thu 22 Oct
- AXP reports earnings on Fri 23 Oct
Data: index, sector, style ETF, VIX and named-stock prices from Yahoo Finance (adjusted closes); earnings dates and times from Yahoo Finance; breadth, dispersion, how closely stocks moved together, highs and lows and the luck check computed from unadjusted daily closes of the 518 stocks in our S&P 500 universe (the US stocks our trading database tracks, with each share class counted (FOX/FOXA, NWS/NWSA); this list is not reconciled with the index's official constituents for the week, and at 518 it is larger than the index's ~503 lines, so it includes some stocks that are not current members), published as aggregates only. Weeks run Friday close to Friday close. Not investment advice.
WAS THIS USEFUL?
Thanks. Add a line if you like.Thanks. Every note is read.
Anonymous: saved without any link to you (no account, cookie or IP address), kept for up to 12 months, and read only by the person who builds these games. Please leave out names, email addresses and other personal details.