
← REPORTS · EVENTS · 07 November 2026
Did the midterm shock reach stocks a day late?
Data and context for education, not investment advice.
IN THIS REPORT · 6 SECTIONS
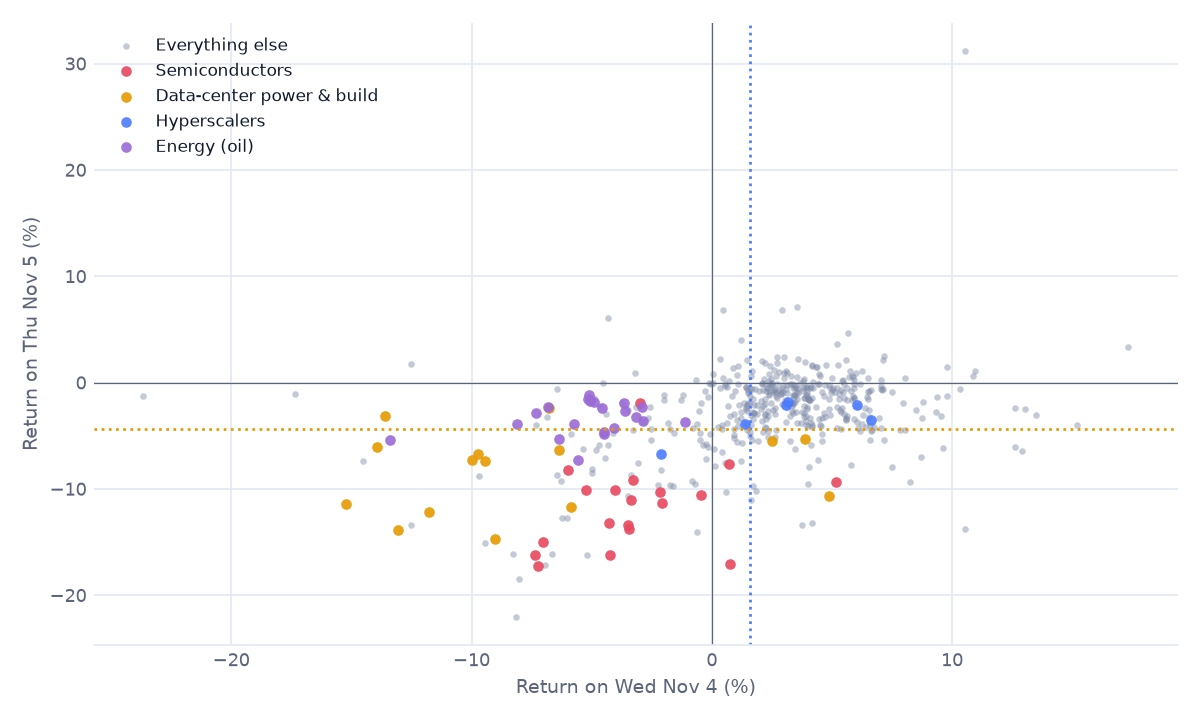
The S&P 500 rose 1.58% on Wed Nov 4 and fell 4.36% on Thu Nov 5. Under Wed's rally (375 of 502 stocks up), the exposed groups were already falling: semiconductors -3.2%, data-center power & build -7.6%, energy (oil) -5.2%, while everything else gained +2.6%. On Thu only 73 stocks rose; 66 of the 107 that fell more than 5% had already fallen on Wed. Daily returns are rebuilt from the abnormal returns and the index's daily moves; re-run the study for exact figures.
Thu Nov 5 falls over 5% that also fell Wed: 66 of 107 · Wed → Thu correlation: +0.43
What it means, in plain English#
Written by an AI model (gpt-5.4-mini) from this study's numbers and the sourced news context below, then reviewed.
In short
The hypothesis is only partly right: the election’s negative was not absent on Wednesday, but it was masked by a broad rally. On Wednesday Nov 4 the S&P 500 rose +1.58% while exposed pockets, especially Energy (-5.16%), Semiconductors (-3.16%), and Data-center power & build (-7.56%), were already weak. On Thursday Nov 5 the index fell -4.36%, with the slump much broader and the heaviest exposed groups leading it. Two-day data suggest day 2 was mostly a late reaction layered onto a wider market selloff, not just a continuation of Wednesday’s losers.
Wednesday Nov 4: hidden, not absent
The negative showed up most clearly in the exposed groups, not in the index.
- Energy was the clearest early loser at -5.16%, and it was -7.74% vs the rest.
- Semiconductors fell -3.16%, -5.73% vs the rest.
- Data-center power & build fell -7.56%, the sharpest group drop, and -10.14% vs the rest.
- Hyperscalers were the main exposed group that did not fall on day 1: they rose +3.02%.
So the election effect was present, but the index hid it because the “everything else” bucket rose +2.57%, and the market’s equal-weight return was +1.74% with 375 stocks up vs 127 down. In other words, the selling was concentrated in the election-sensitive names while the broader market was strong enough to overpower it.
Thursday Nov 5: the negative reaches the index
By Thursday the index finally reflected the weak exposed groups and a much wider market decline. The S&P 500 fell -4.36%; breadth turned sharply negative, with 73 stocks up vs 429 down, an equal-weight return of -3.09%, and 107 stocks down more than 5%.
The exposed groups were still weak: - Semiconductors: -11.68%, -9.16% vs the rest - Data-center power & build: -8.31%, -5.79% vs the rest - Energy: -3.38%, -0.86% vs the rest - Hyperscalers: -3.37%, -0.85% vs the rest
So the election-related weakness was still there, but the day 2 drop was not confined to those groups. The rest of the market also fell -2.52%, which means a large part of the index drop was broad, non-specific selling.
Was the reaction delayed?
Mostly yes, but not entirely. The data point to both continuation and a fresh, later reaction.
Continuation was real: - The correlation between day 1 and day 2 stock returns was 0.43. - Of the 107 stocks that fell more than 5% on Thursday, 66 had already fallen on Wednesday. - The main late fallers were concentrated in Information Technology (10), Consumer Discretionary (6), Financials (6), Industrials (5), and Real Estate (4).
But there was also a clear new shock: - 41 of the big Thursday losers had risen on Wednesday. - Hyperscalers, which had mostly held up on Wednesday, joined the decline on Thursday. - Some of the biggest Wednesday winners later reversed hard, such as APP (+10.55% on Wednesday, +31.21% on Thursday) and CPAY (+2.94%, then +6.81%), showing the second day was not just a repeat of the first.
So day 2 was part continuation, part late catch-up, and broad enough to hit names that had not been damaged on day 1.
How big was the anomaly
| Day | Index move | Exposed groups’ gap to the rest | Breadth |
|---|---|---|---|
| Wed Nov 4 | +1.58% | Semis -5.73% vs rest; Data-center power & build -10.14% vs rest; Energy -7.74% vs rest; Hyperscalers +0.45% vs rest | 375 up / 127 down; equal-weight +1.74%; median +2.58% |
| Thu Nov 5 | -4.36% | Semis -9.16% vs rest; Data-center power & build -5.79% vs rest; Energy -0.86% vs rest; Hyperscalers -0.85% vs rest | 73 up / 429 down; equal-weight -3.09%; median -2.27% |
On Wednesday, the anomaly was concentrated in a few exposed groups while the index stayed green. On Thursday, the shock broadened sharply and the index finally turned negative.
What else moved markets
Wednesday’s rally was helped by a reported relief tone after Trump’s conciliatory comments, even though Energy and Industrials were weak and tech was only roughly flat [TheStreet].
Thursday had several reported catalysts at once: AI/data-center scrutiny tied to the Democratic wins, weak Qualcomm and Arm results/guidance, a jump in oil after tanker attacks near Hormuz, and higher odds of a December rate hike [NBC/AP; finzdata]. Because those catalysts overlapped, two days of data cannot split Thursday between the election and the others. The exposed groups’ gap to the rest is the most the election-specific share could plausibly be, while the rest-of-market move is the broader non-election component.
How far to trust this
The main day-to-day returns and breadth are directly from the two-day reaction data. The support-window stats are only useful for judging whether an individual stock’s move was unusual for that stock; they should not be used to explain the day itself, and market-model abnormal returns will understate the day-2 shock in the heaviest names because those names also dragged the index. Returns were reconstructed.
Wednesday against Thursday#
Exposed groups each day
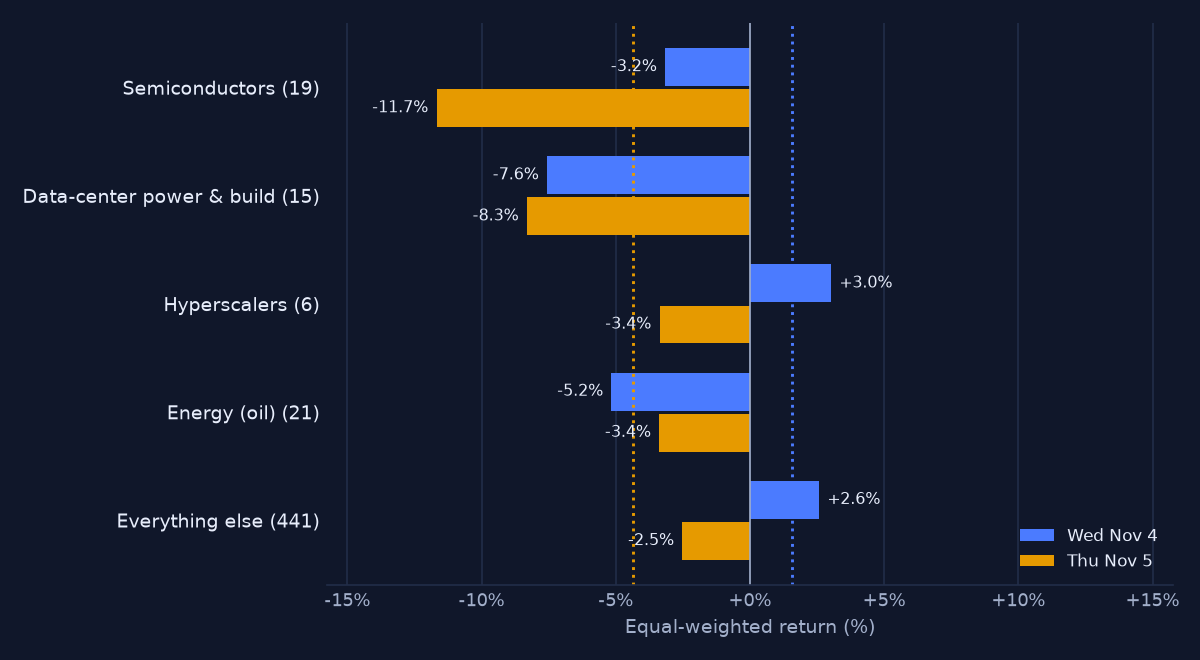
Equal-weighted return of each group the election coverage named, against everything else. Dotted lines: the S&P 500 each day.
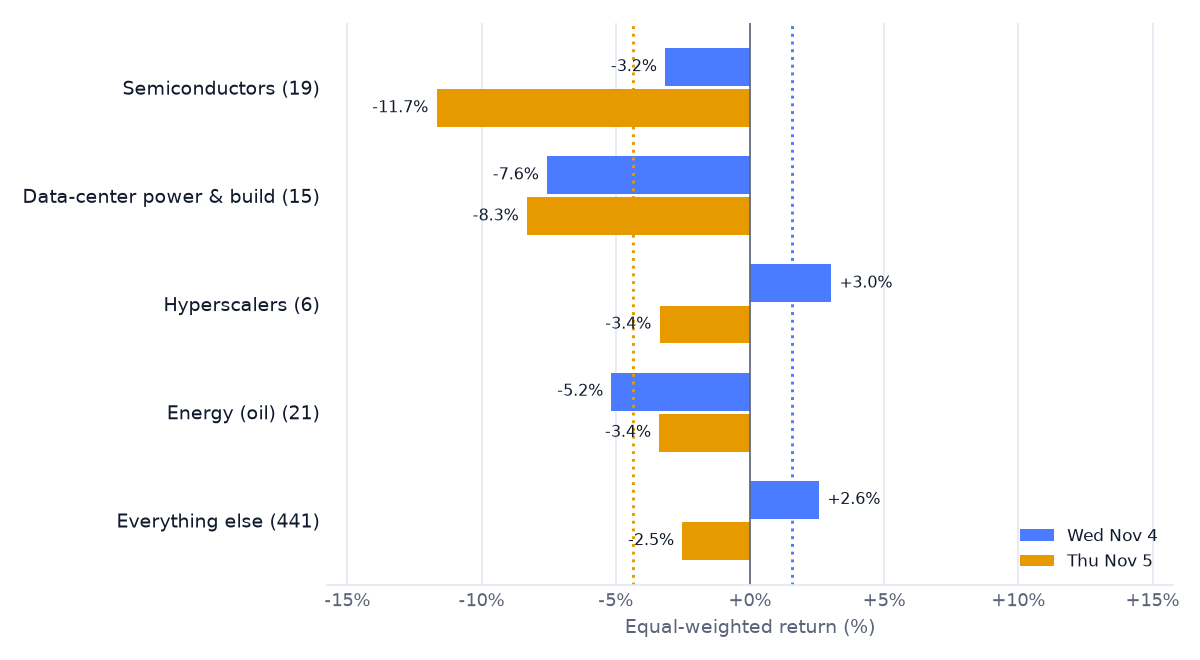
| Group | Stocks | Wed Nov 4 | Thu Nov 5 | Wed vs rest | Thu vs rest |
|---|---|---|---|---|---|
| Semiconductors | 19 | -3.2% | -11.7% | -5.7 pts | -9.2 pts |
| Data-center power & build | 15 | -7.6% | -8.3% | -10.1 pts | -5.8 pts |
| Hyperscalers | 6 | +3.0% | -3.4% | +0.5 pts | -0.8 pts |
| Energy (oil) | 21 | -5.2% | -3.4% | -7.7 pts | -0.9 pts |
| Everything else | 441 | +2.6% | -2.5% | — | — |
Sectors each day
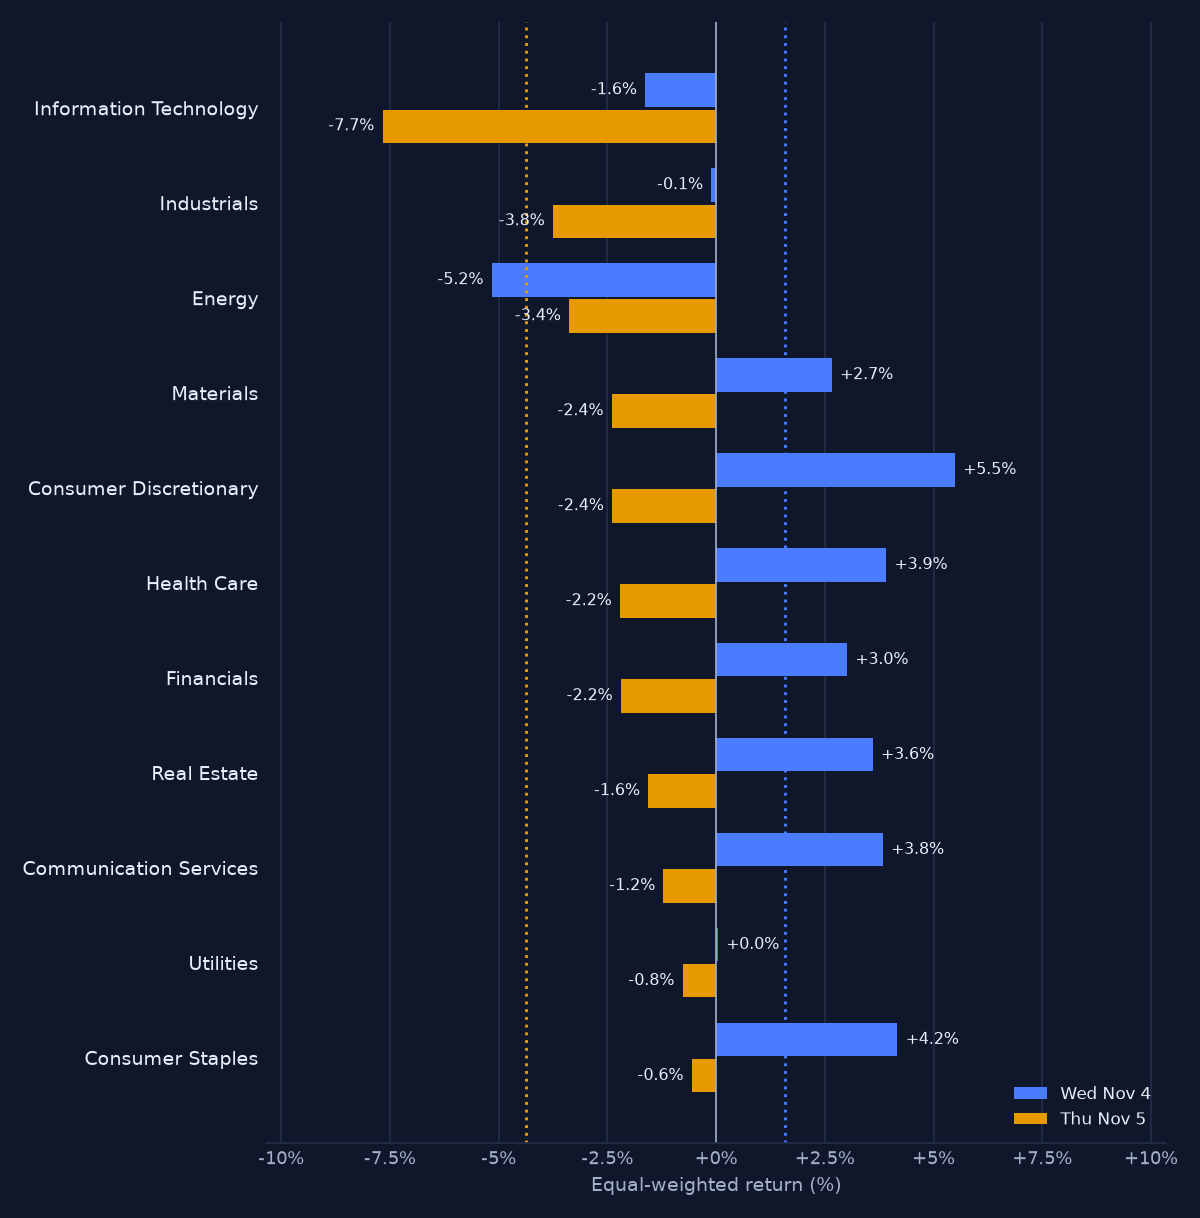
Equal-weighted return of each GICS sector, weakest on the second day at the top. Dotted lines: the S&P 500 each day.
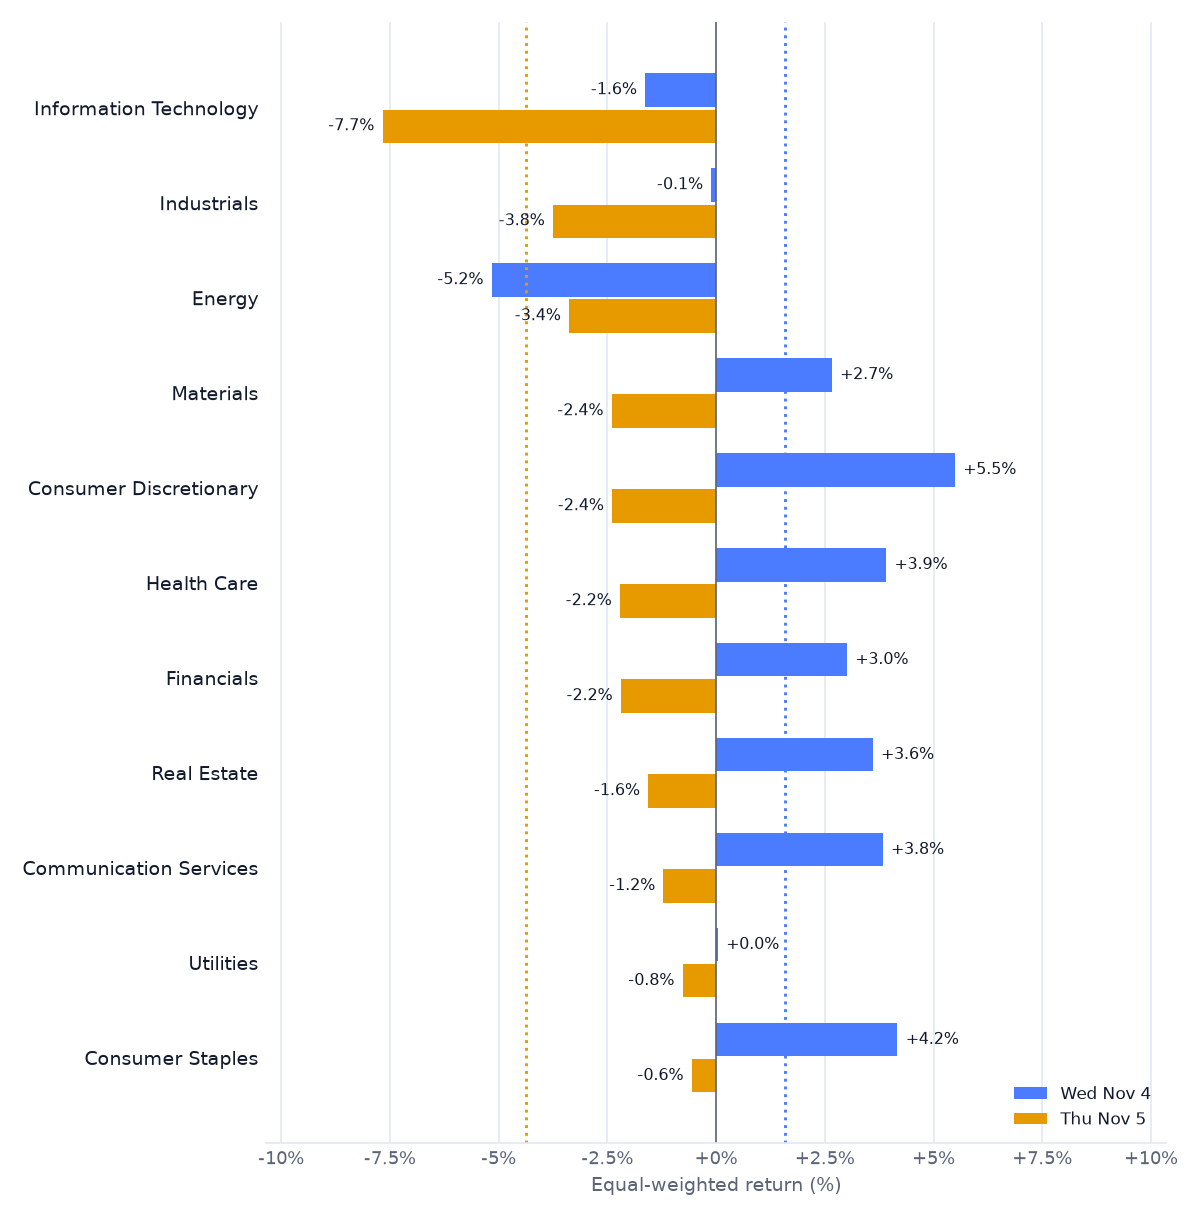
Every stock: Wednesday against Thursday
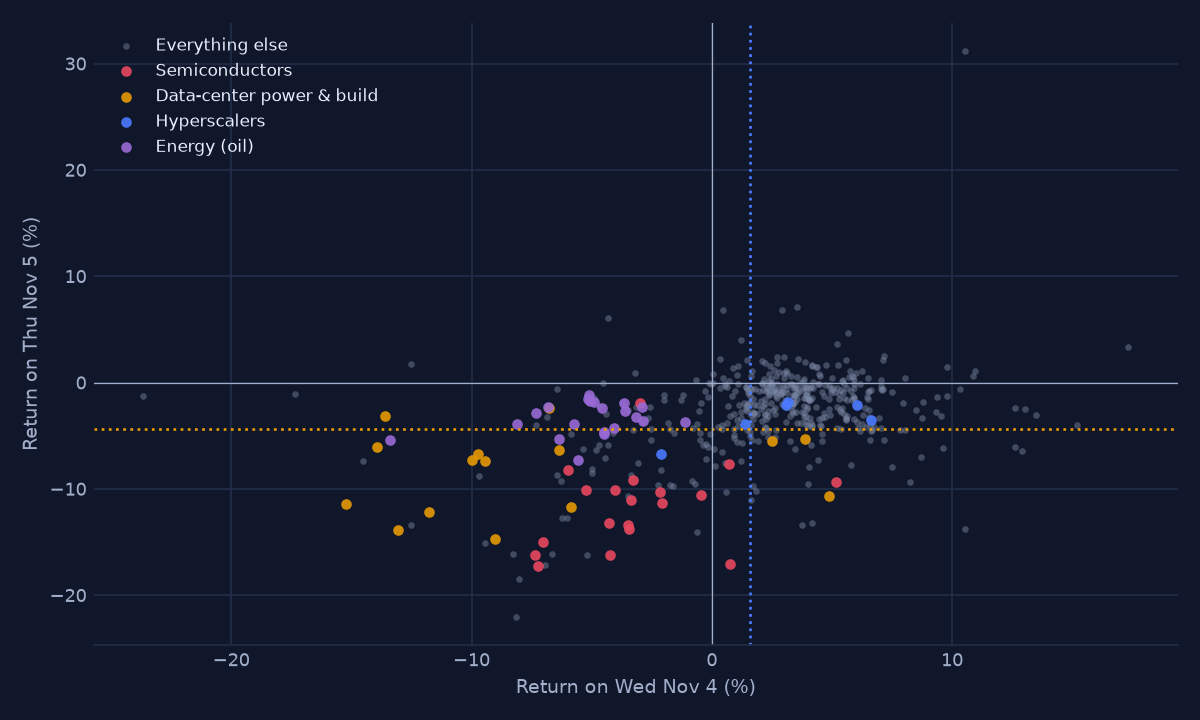
Bottom-left: fell both days, so Thursday extended a Wednesday markdown. Bottom-right: held up on Wednesday and fell on Thursday, the late reaction. Dotted lines: the S&P 500 each day.
Support: the beta-adjusted view, fitted before the vote#
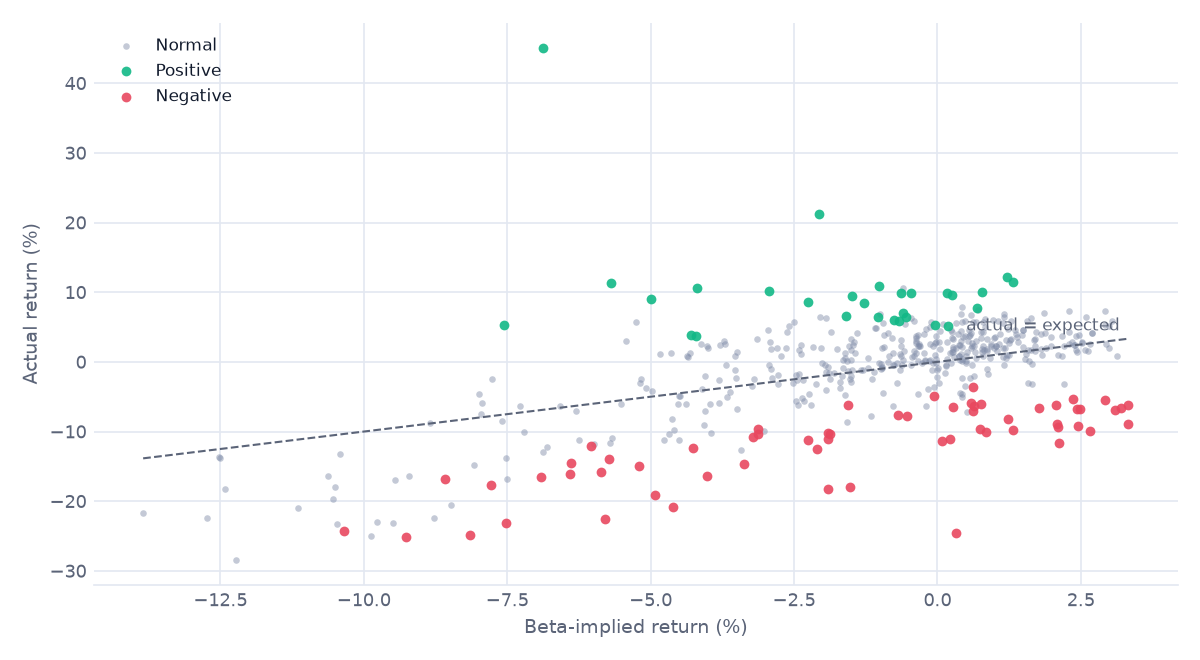
These figures use betas from the months before the election. They say whether a move was unusual for that stock. Because AI stocks dominate the index, the model books their Thursday fall as "market", so it understates the Thursday shock in exactly the names that drove it.
| Z anomalies | Negative / positive | Expected by chance | Spread of Z (1 = normal) | Negative betas |
|---|---|---|---|---|
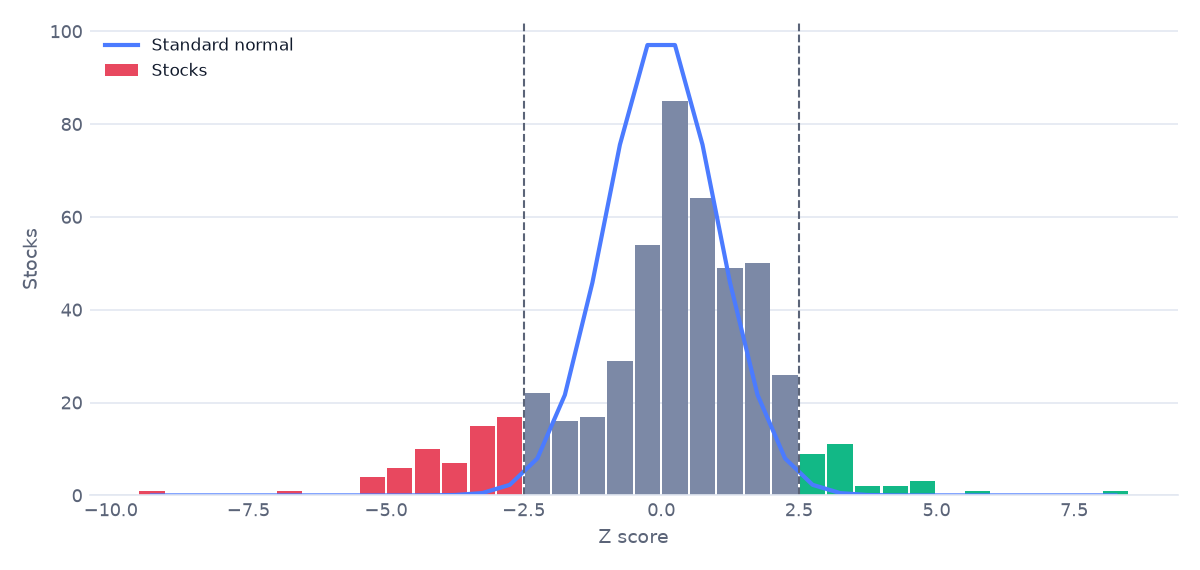
| 90 of 502 | 61 / 29 | 6 | 1.98 | 203 of 502 |
Market noise or company shock
Actual return against the beta-implied return
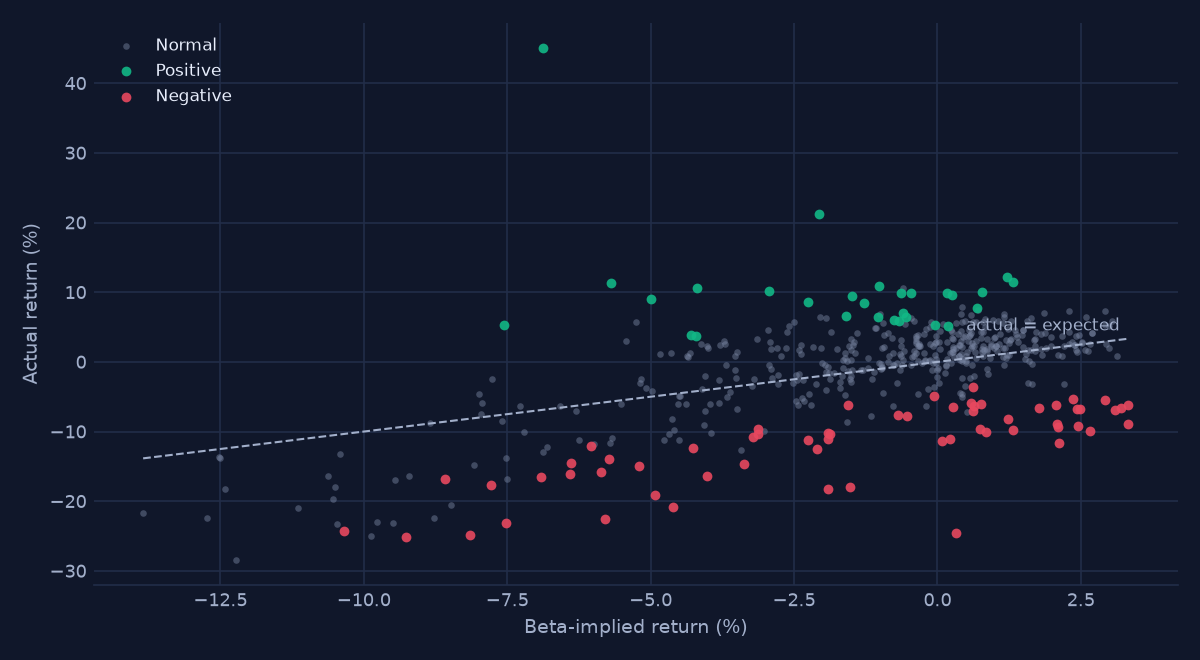
On the dashed line a stock did exactly what its beta and SPY's move predicted. The vertical distance is its abnormal return.
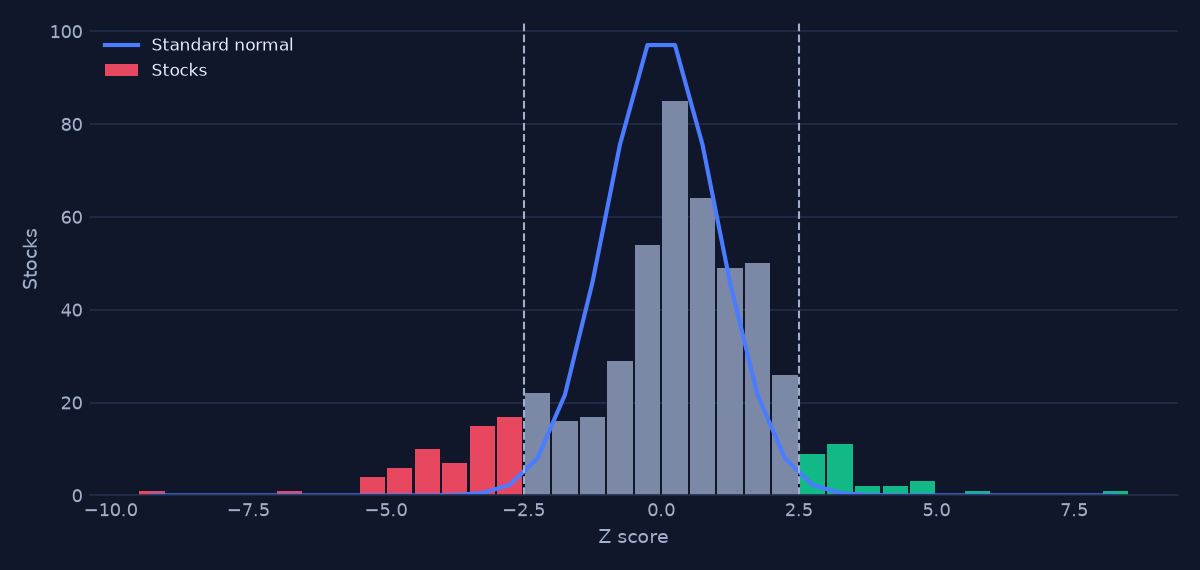
How Z is distributed
Stocks per half-unit of Z against a standard normal. Bars past ±2.5 are anomalies; fat tails mean more anomalies than chance.
Where the abnormal returns landed
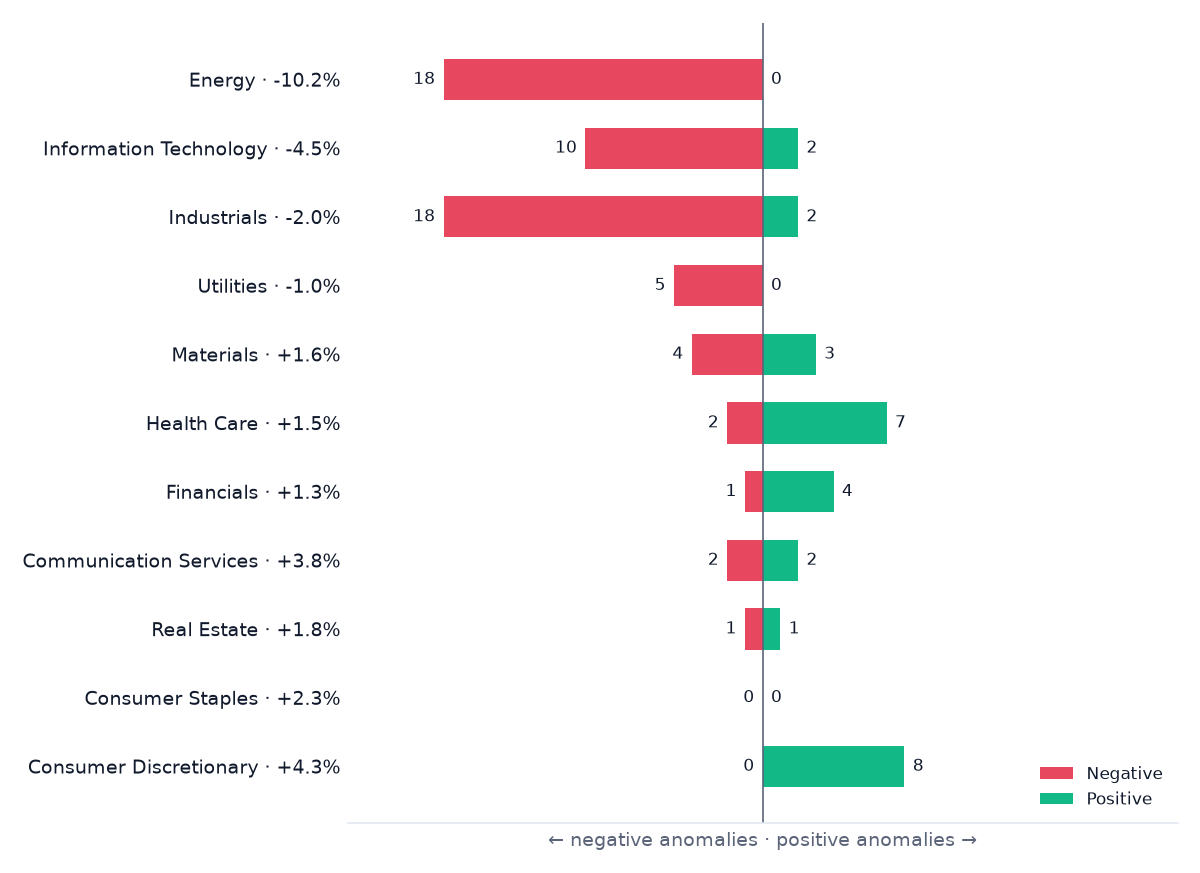
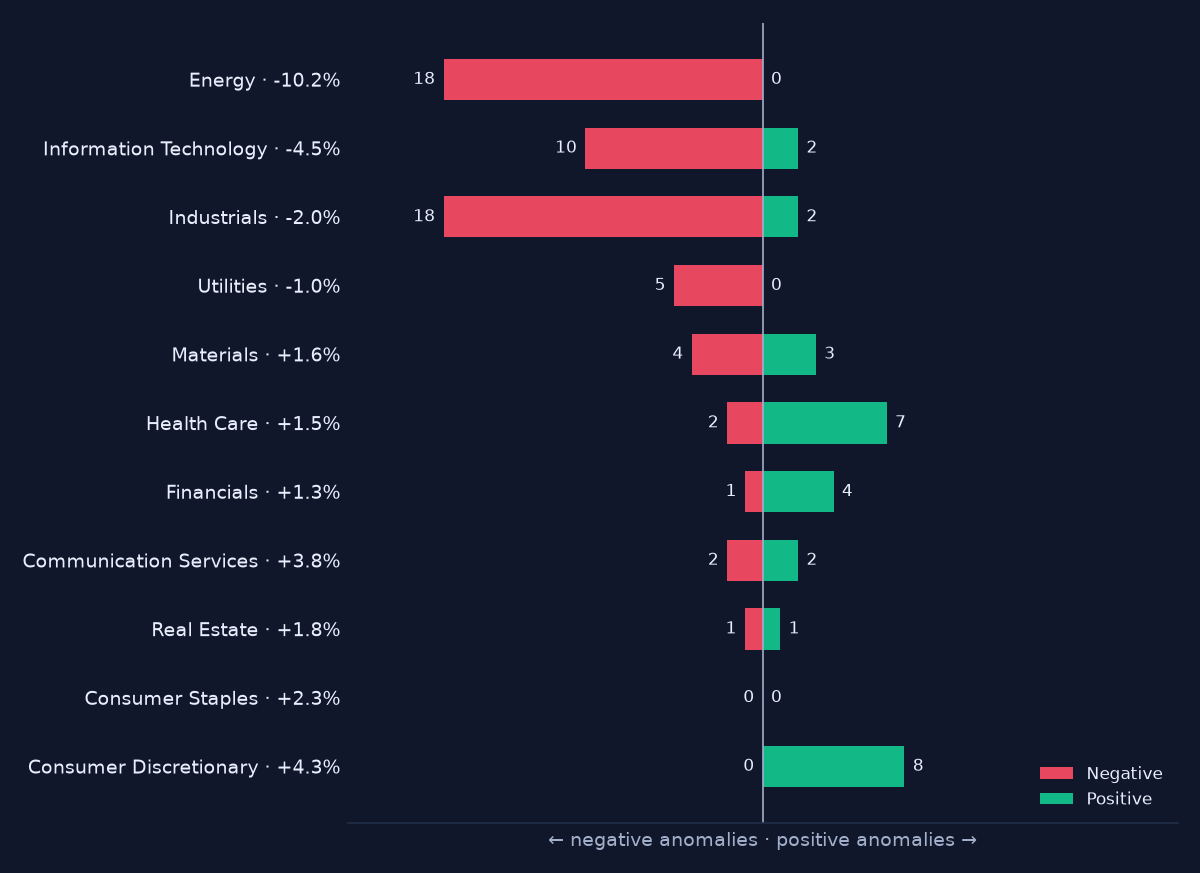
Anomalies by sector
Sectors ordered by mean Z, most negative at the top. The figure after each name is the sector's mean CAR.
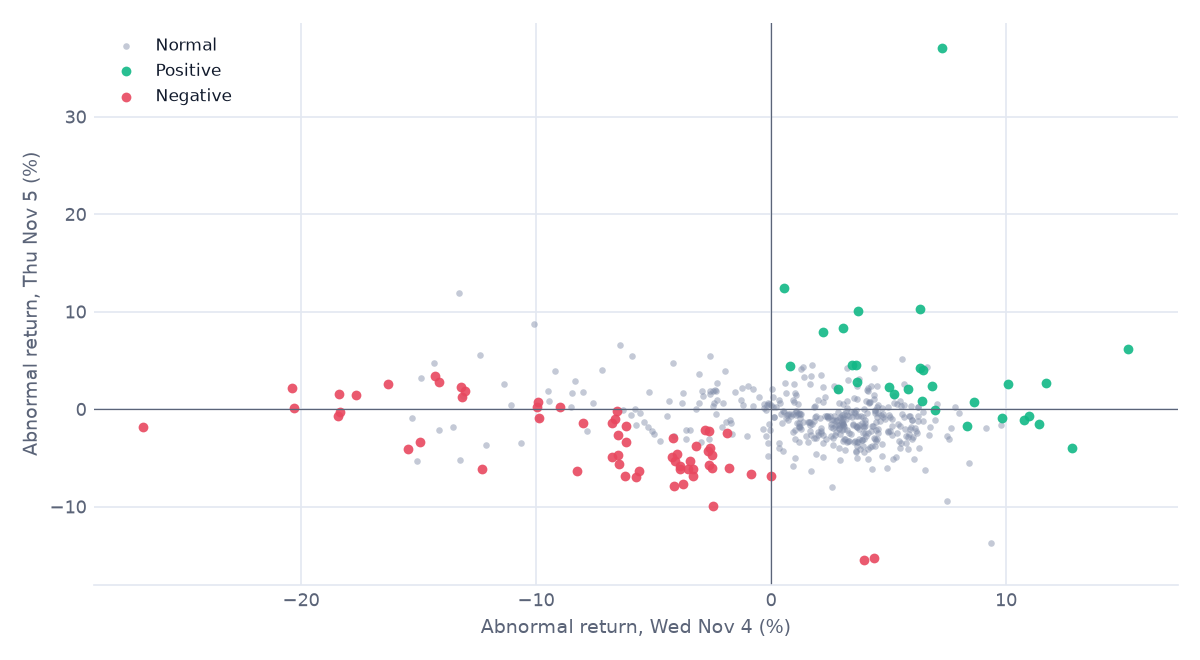
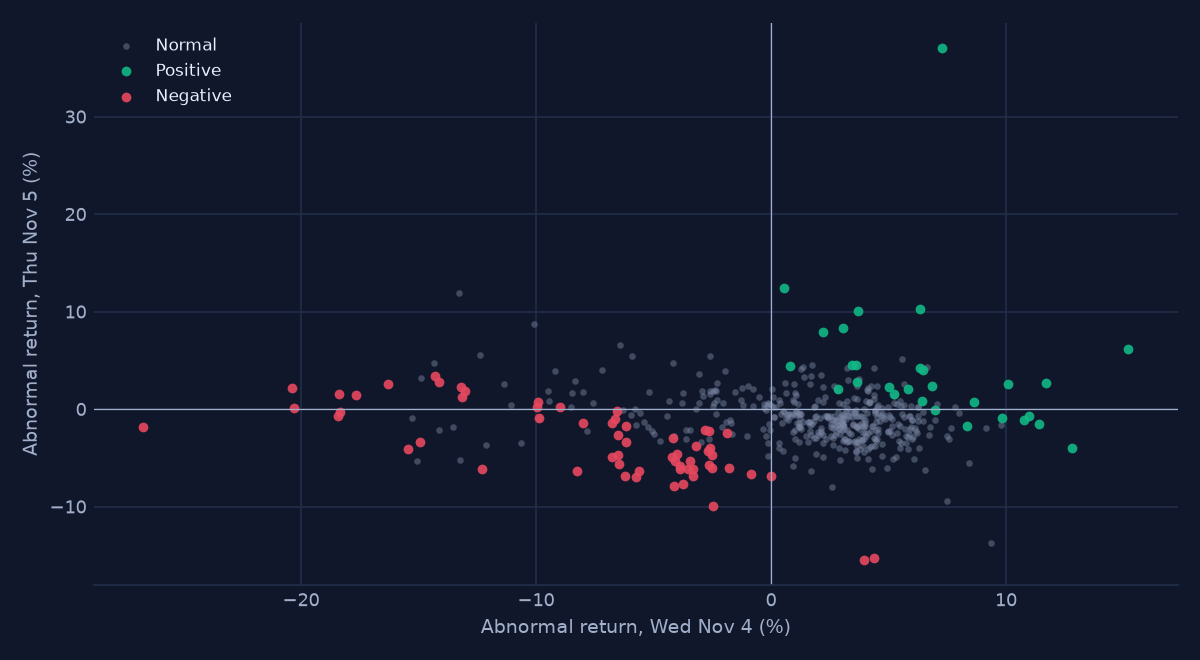
Abnormal return by day
Return beyond beta on each day. Points near the horizontal axis took their hit on the first day; points near the vertical axis on the second.
Model check
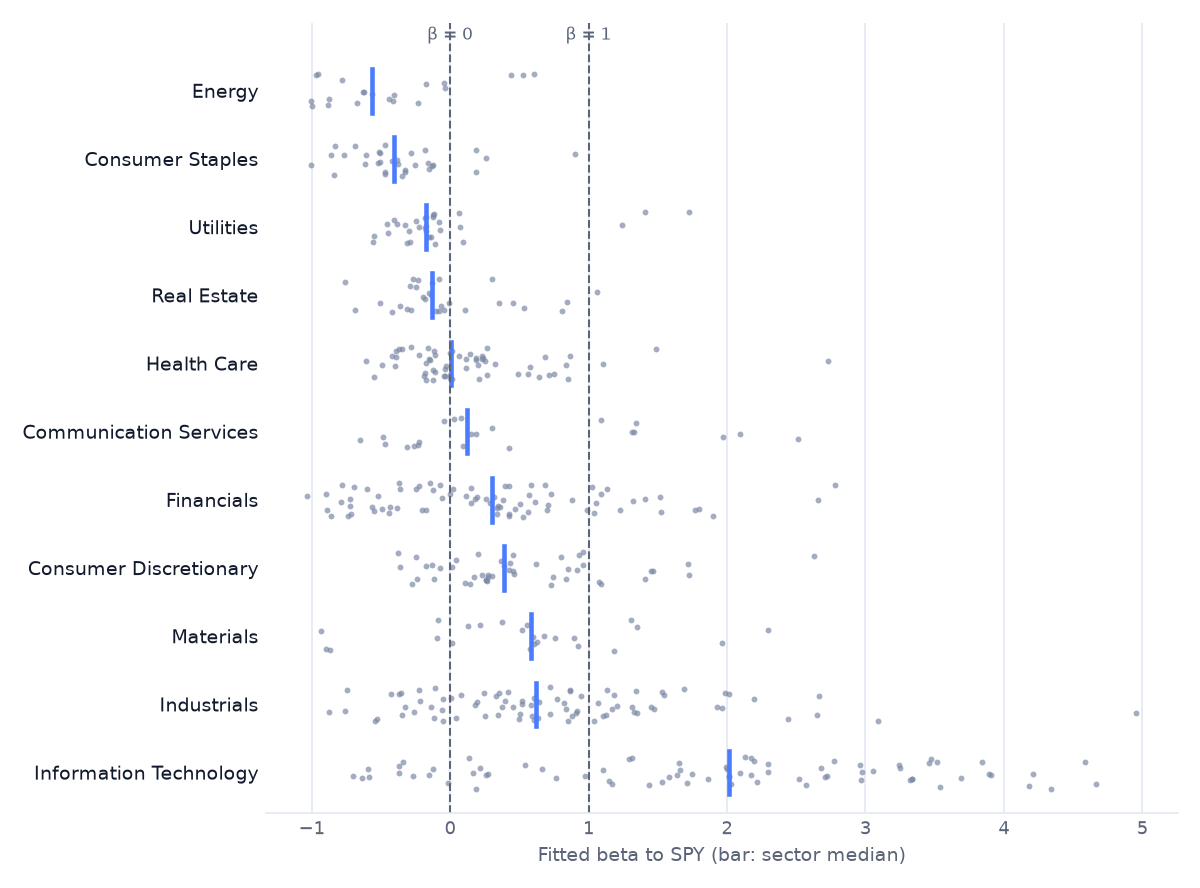
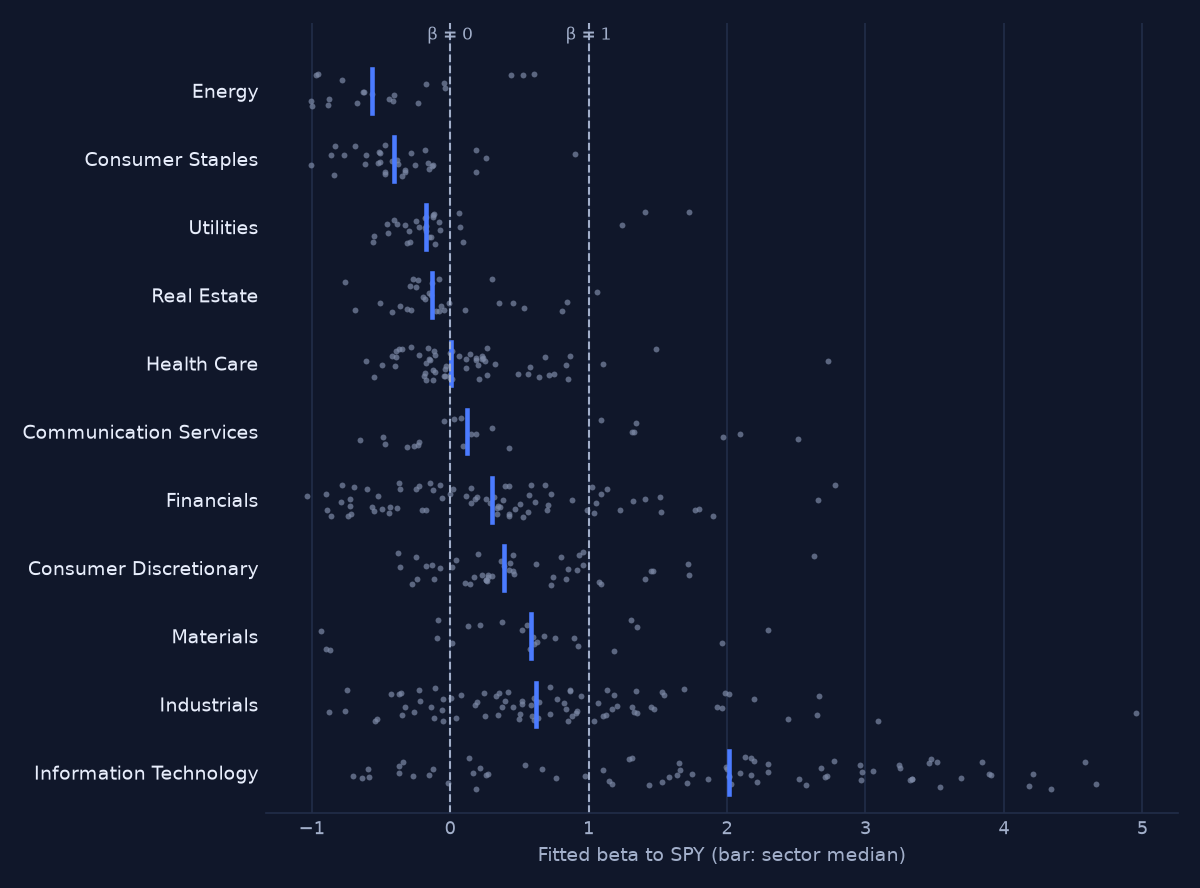
Fitted betas by sector
S&P 500 betas usually sit between about 0.5 and 1.5. A sector centred below zero means the model expected it to rise when SPY fell, so part of its abnormal return comes from the model, not from news.
Stocks#
The 12 biggest fallers and 8 biggest risers on Thu Nov 5. The app lists all 502.
| Ticker | Sector | Group | Wed Nov 4 | Thu Nov 5 | Z status | Z |
|---|---|---|---|---|---|---|
| SNDK | Information Technology | Everything else | -8.2% | -22.1% | Normal | -2.31 |
| LITE | Information Technology | Everything else | -8.0% | -18.5% | Normal | -2.34 |
| MU | Information Technology | Semiconductors | -7.2% | -17.3% | Normal | -2.33 |
| WDC | Information Technology | Everything else | -7.0% | -17.2% | Normal | -2.33 |
| AMD | Information Technology | Semiconductors | +0.8% | -17.1% | Normal | -1.46 |
| P | Information Technology | Everything else | -5.2% | -16.2% | Normal | -2.44 |
| MRVL | Information Technology | Semiconductors | -7.3% | -16.2% | Normal | -1.60 |
| LRCX | Information Technology | Semiconductors | -4.2% | -16.2% | Normal | -2.08 |
| BE | Industrials | Everything else | -6.6% | -16.2% | Normal | -1.22 |
| STX | Information Technology | Everything else | -8.3% | -16.1% | Negative | -2.90 |
| CIEN | Information Technology | Everything else | -9.4% | -15.1% | Normal | -2.46 |
| TER | Information Technology | Semiconductors | -7.0% | -15.0% | Normal | -1.92 |
| APP | Communication Services | Everything else | +10.5% | +31.2% | Positive | 8.01 |
| TPR | Consumer Discretionary | Everything else | +3.5% | +7.1% | Positive | 3.05 |
| VRSK | Industrials | Everything else | +0.5% | +6.8% | Normal | 1.32 |
| CPAY | Financials | Everything else | +2.9% | +6.8% | Positive | 4.30 |
| CF | Materials | Everything else | -4.3% | +6.1% | Normal | -0.37 |
| CHTR | Communication Services | Everything else | +5.7% | +4.7% | Normal | 2.27 |
| MSI | Information Technology | Everything else | +1.2% | +4.0% | Positive | 2.50 |
| ALB | Materials | Everything else | +5.2% | +3.7% | Positive | 3.80 |
How the numbers are worked out#
The two days (primary). Each stock's actual return on Wednesday Nov 4 and Thursday Nov 5. Groups and
sectors are equal-weighted averages, so a group's figure is what its typical member did, not its weight in
the index. "Vs rest" compares a group with every stock outside the exposed groups and energy. Exposed
groups are set by ticker in analysis.GROUPS: semiconductors, data-center power and construction, and
the hyperscalers; Energy is the whole GICS sector. The index's move in standard deviations uses its
daily volatility over the estimation window, when the study saved it.
Support (fitted before the vote).
- Expected return: alpha + beta × SPY's return each day, with alpha and beta fitted by OLS on the trading days before the event.
- Abnormal return (AR) is the actual log return minus the expected return; CAR sums it over the event days.
- Z = CAR ÷ (the stock's residual volatility × √days). A stock is an anomaly when |Z| ≥ 2.5; a standard normal puts 1.24% of stocks there by chance.
- Left out: earnings dates (early November is peak Q3 reporting, so some anomalies are earnings) and sector factors. Stocks missing an event-day price or with under 80 days of history were dropped.
- The plain-English analysis is written by an OpenAI model from the summary numbers only. It can be wrong; check it against the charts.
Sources#
- TheStreet, "Stock Market Today (Nov. 4, 2026)": https://www.thestreet.com/stock-market-today/stock-market-today-dow-jones-sp-500-nasdaq-updates-nov-04-2026
- NBC Bay Area / AP, "A brutal sell-off for AI stocks…": https://www.nbcbayarea.com/news/national-international/november-5-stock-market/4170982/
- finzdata, "Why Did the Stock Market Crash on Nov 5, 2026?": https://finzdata.com/research/ai-unwind-selloff-november-2026
Education only. Statistics from past daily prices (Yahoo Finance): they show which moves the market does not explain, not why. Not investment advice.
WAS THIS USEFUL?
Thanks. Add a line if you like.Thanks. Every note is read.
Anonymous: saved without any link to you (no account, cookie or IP address), kept for up to 12 months, and read only by the person who builds these games. Please leave out names, email addresses and other personal details.